One common problem in data visualisation is the representation of two sets of data, which have a common subset of elements: a percentage of their contents which are present in both. The obvious solution to this issue is to draw a Venn diagram: two overlapping circles, where the overlap represents the percentage of common elements.

The main issue in drawing a Venn diagram is, given the percentage of overlap, determining the placement of the circles such that it visually matches the stated overlap. Once the circle dimensions and placements have been worked out, the image manipulation is relatively straightforward.
In this article, I'll be using PHP to demonstrate the implementation, and the imagick interface to ImageMagick in order to draw and output the image.
Geometry: Overlapping circles
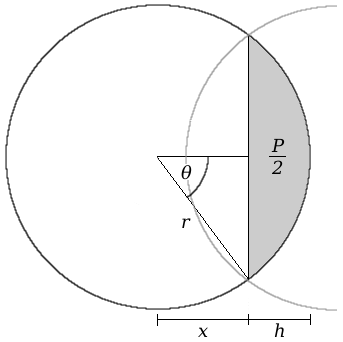
Mathematically, two overlapping circles will cross each other at two points: a line between these two points is a chord of the circles, and the area contained within each chord segment by this line is 50% of the total overlap.

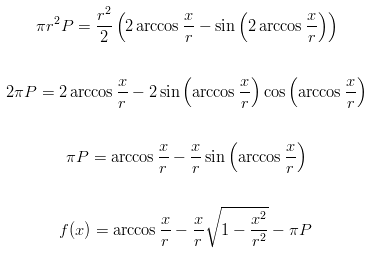
In order to correctly place the circles, it's important to find out what x and h are in the above diagram; knowing these values will allow for easy calculation of the horizontal positions. By using the standard formulae for area and angle of a circle segment, the following equation can be obtained.

By solving this equation, we can get the length of the sagitta, x. The problem presented by this equation, however, is that it cannot be solved analytically by working with the equation terms. A numerical approach will need to be used, to find a solution.
The Newton-Raphson iterative method
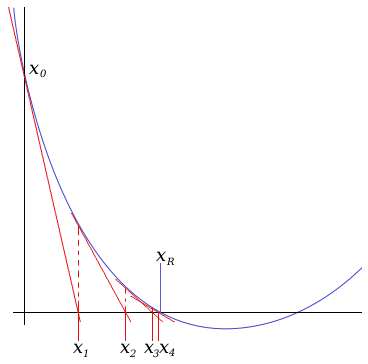
One of the most common numerical algorithms for solving an equation is the Newton-Raphson method, also known as Newton's method. It uses the gradient of the function at a particular point, to guess the next point. By picking a good starting point, it's possible to quickly narrow down a solution to the function (the point at which it crosses the x-axis).

As can be seen in the above figure, the algorithm follows the gradient line down to the x-axis, and uses the crossing point there as its next guess for the solution. Taking another gradient from the function at that point, the algorithm homes in on the solution within (in the above case) 4 or 5 iterations. When used on a formula, the gradient is represented by the differential of the formula in question; for the sagitta length formula, the differential is:

With both formulae to hand (the function itself and the differential), the iteration process is a simple calculation:

This calculation can be repeated until the answer is close to the expected solution: in other words, when successive iterations don't result in a significant change to the answer. The definition of "significant change" depends on the problem: in this case, I'll be using "the same to four decimal places".
As an example, suppose that the Venn diagram in Figure 1 is being generated: a diagram showing 20% overlap, where each circle has a radius of 150 pixels. Plugging these values into the Newton-Raphson solver shows the following values for each iteration.
Iteration results for an example diagram
0.0000
94.2478
102.7742
103.0570
103.0573
103.0573
As can be seen, the solver quickly converges on the answer for the length x. From here, h can be calculated as the difference between x and the radius, and the angle θ as:

Implementing the solver
In PHP, the solver can be implemented by defining the sagitta formula and its differential as two functions, and using a recursive function to run through their values. The following implementation contains a "safety valve" for the solver, for the general case where the equations may cause a divergence if the solver starts at x=0. In the case of this equation, the safety valve is unnecessary, since the algorithm will always converge if it starts at 0; it is included below for completeness.
Iterative solver implementation
class Sagitta
{
	// The sagitta length formula
	static function f($x, $r, $P)
	{
		return acos($x/$r)-(M_PI*$P)-(($x/($r*$r))*sqrt(($r+$x)*($r-$x)));
	}

	// Differential of the length
	static function fp($x, $r, $P)
	{
		$s = sqrt(1-(($x*$x)/($r*$r)));
		return (((($x*$x)/($r*$r*$r)) - (1/$r)) / $s) - ($s/$r);
	}

	// Recursive solver
	// Built-in safety valve at 10 levels down
	static function solve($x, $r, $P, $level=10, $precision=0.0001)
	{
		$xn = $x - (self::f($x,$r,$P) / self::fp($x,$r,$P));
		if($level && (abs($xn - $xn) > $precision))
			return self::solve($xn, $r, $P, $level-1);
		else
			return $xn;
	}
}

$radius = 150;
$overlap = 0.2;

// Each circle contains half of the overlap; use this to calculate x
$x0 = 0;
$x = Sagitta::solve($x0, $radius, $overlap/2);
Drawing the Venn diagram
Using PHP and imagick, the Venn diagram can be drawn quickly and efficiently based on the value for x obtained above. There are, however, a few issues that must be resolved:
- Circle placement: In order to plot a circle in
imagick, its centre coordinate must be given, and this must be calculated horizontally for both circles. For the left-hand circle, this is simply one radius in from the left of the image. The right-hand circle would be three radii from the left edge, if there were no overlap; from Figure 2, it can be seen that there is 2h of overlap, so this must be subtracted from the horizontal coordinate of the right-hand circle. - Intersection: The two circles can be drawn easily, but the circle segments representing the intersection could cause difficulty. Fortunately,
imagickprovides a construct for drawing an ellipse segment: given two angles, it will plot the arc and chord between them, and fill the space in the "fill colour" defined beforehand. - Image size: As with the circle placement, the horizontal dimension of the image is lower than may be expected. Without overlap, the image would be as wide as both circle diameters put together; the overlap of 2h must again be subtracted from this if the image is not to be too wide.
Having taken these issues into account, the following code will generate the Venn diagram given x.
Image rendering implementation
$h = $radius - $x; $theta = acos($x/$r) * (180 / M_PI);// 5 pixels of padding around the Venn$padding = 5; $overlap_width = 2*$h; $im = new Imagick(); $im->newImage($r*4 - $overlap_width + ($padding*2), $r*2 + ($padding*2), new ImagickPixel('white')); $draw = new ImagickDraw();// Left-hand circle, in green$draw->setFillColor(new ImagickPixel('#88ff88')); $draw->ellipse($r + $padding, $r + $padding, $r, $r, 0, 360);// Right-hand circle, in blue$draw->setFillColor(new ImagickPixel('#8888ff')); $draw->ellipse($r*3 - $overlap_width + $padding, $r + $padding, $r, $r, 0, 360);// Intersection, in cyan // Angles are specified in degrees, from the rightmost point of the circle$draw->setFillColor(new ImagickPixel('#88ffff'));// Left-hand segment (right half of intersection) // -theta is in the top right, +theta in the bottom right$draw->ellipse($r + $padding, $r + $padding, $r, $r, -$theta, $theta);// Right-hand segment (left half of intersection) // 180-theta is in the bottom left, 180+theta in the top left$draw->ellipse($r*3 - $overlap_width + $padding, $r + $padding, $r, $r, 180-$theta, 180+$theta);// Image bounding rectangle$draw->setStrokeColor(new ImagickPixel('black')); $draw->setStrokeWidth(1); $draw->setFillOpacity(0); $draw->rectangle(0, 0, $r*4 - $overlap_width + ($padding*2) - 1, $r*2 + $padding - 1);// Output image$im->drawImage($draw); $im->setImageFormat('png'); header('Content-type: image/png'); echo $im;
The above code results in Figure 1.
Issues and enhancements
One problem that remains with this implementation is the range of overlap percentages. If an overlap of less than 0% is given (if, in other words, the sets don't overlap), the equations above result in complex roots and PHP crashes while attempting to calculate them. Similarly, if the overlap is specified as more than 100%, this should reverse the positions of the sets in the Venn diagram; instead, the equations will produce a small section of one circle which is rendered as all intersection. A simple range check on the overlap percentage can alleviate these issues, and prevent them from being passed through to the script.
Another limitation is the inherent tie of two sets that is implied by this script; it is not possible to specify an overlap between three sets using this model. The geometry to allow for three intersecting circles to be specified is left as an exercise for the reader.
Imran Nazar <tf@imrannazar.com>, May 2010.